IoTool Grafana guidelines
Adminer
Main page
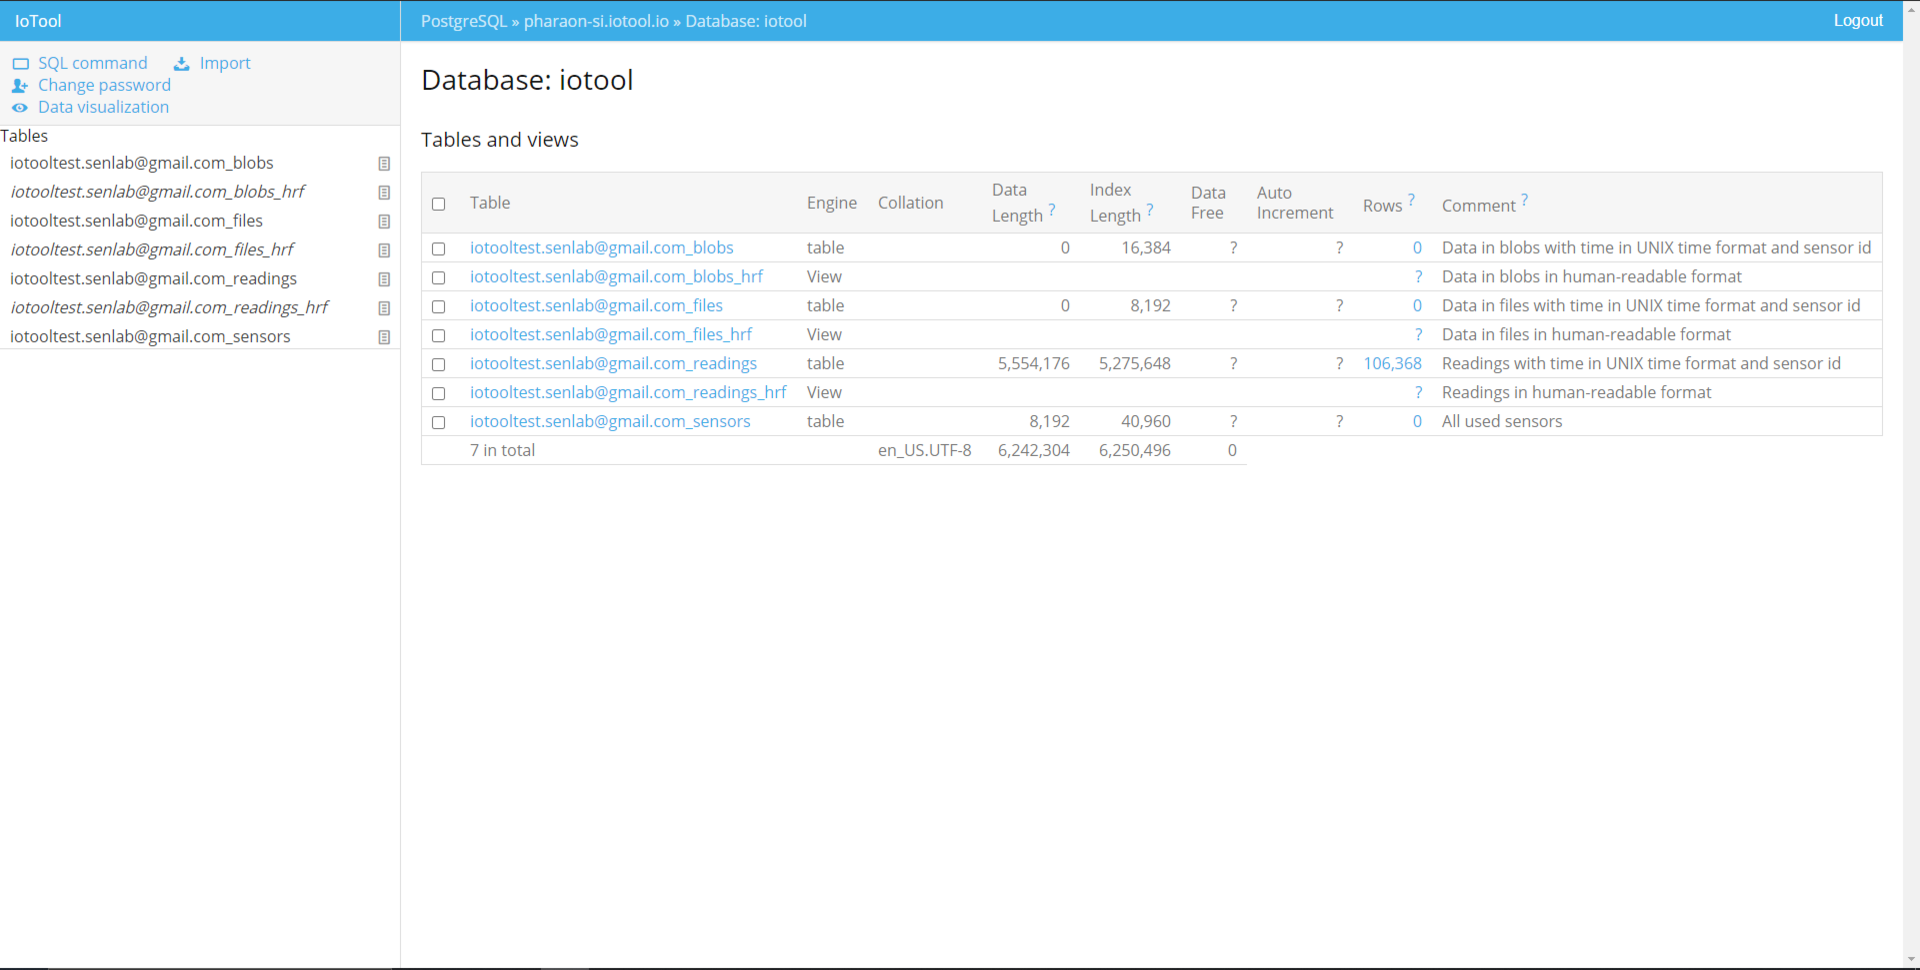
On the main page, there is a side menu with multiple options:
-
SQL command; where you can enter your SQL query
-
Import; where you can import data from your computer
-
Change password; where you can change your password
-
Data visualization; from where Grafana can be accessed
-
Data visualization; from where Grafana can be accessed
Under these options are listed all the tables of your database.
Tables
Data should already be uploaded to the cloud. Select _readings_hrf table and "Select data", sort it by date, and check if the readings are present there. If they are, it should look something like this:
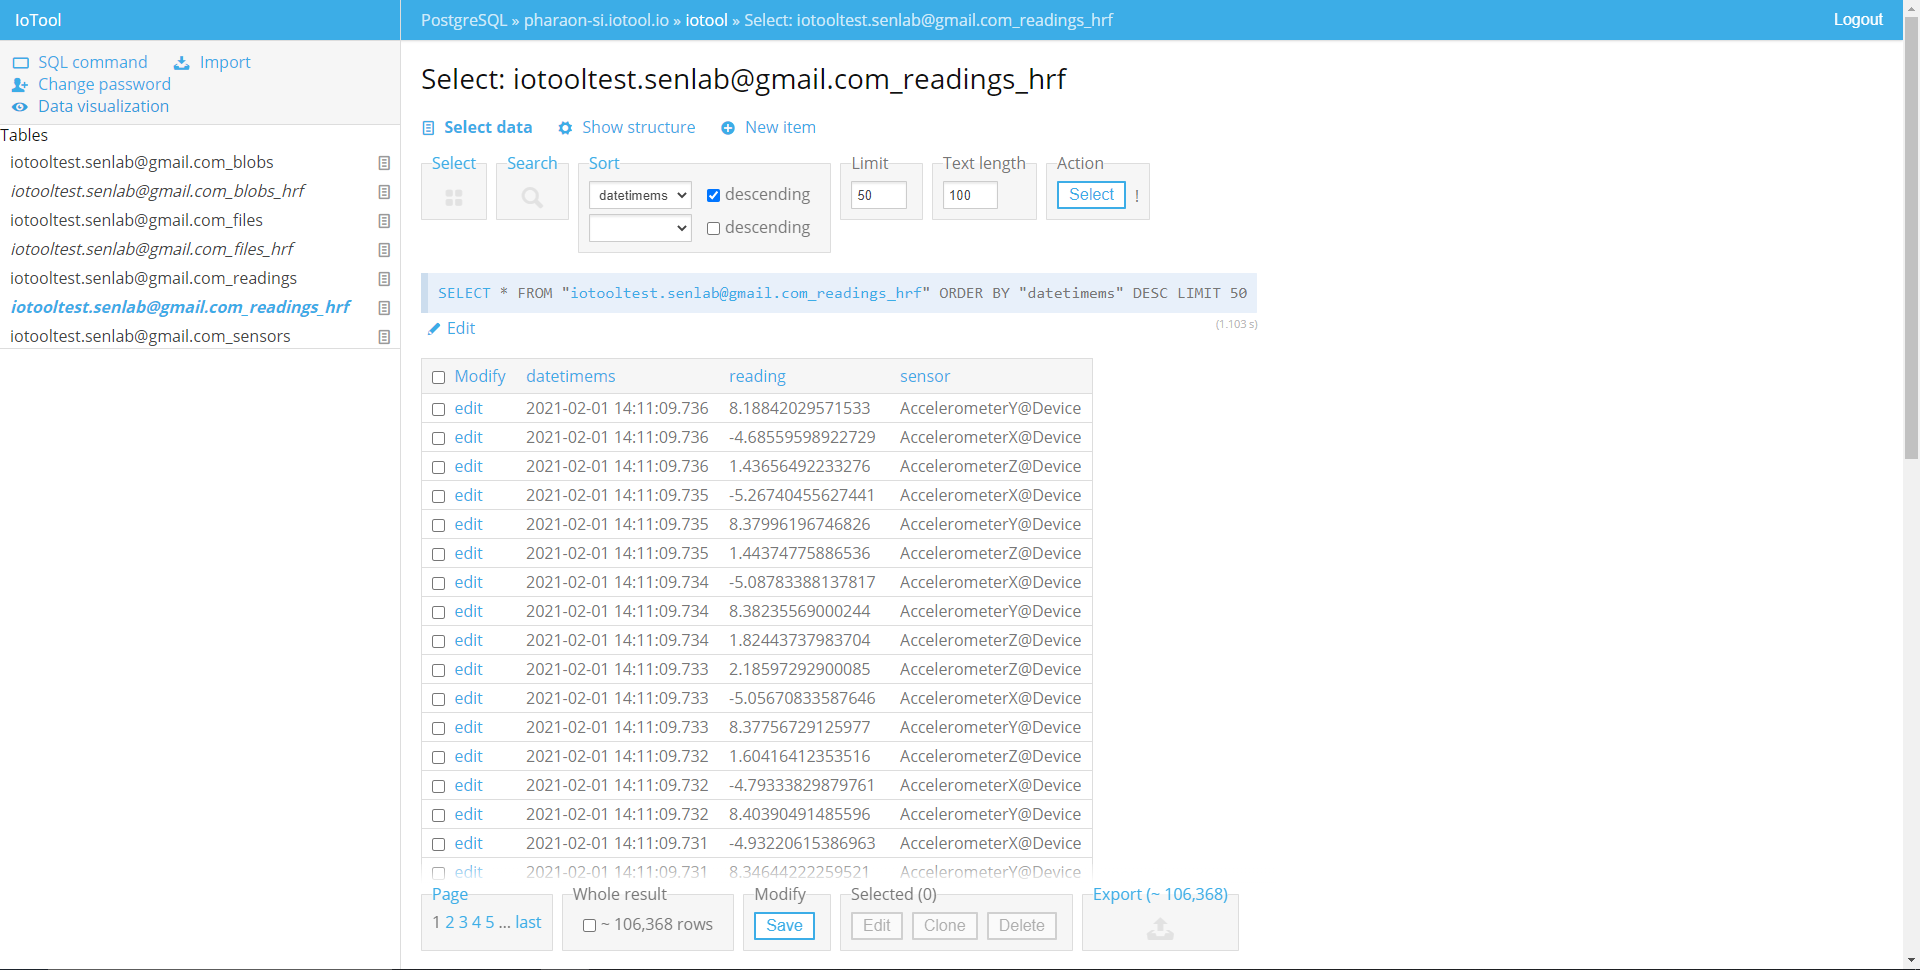
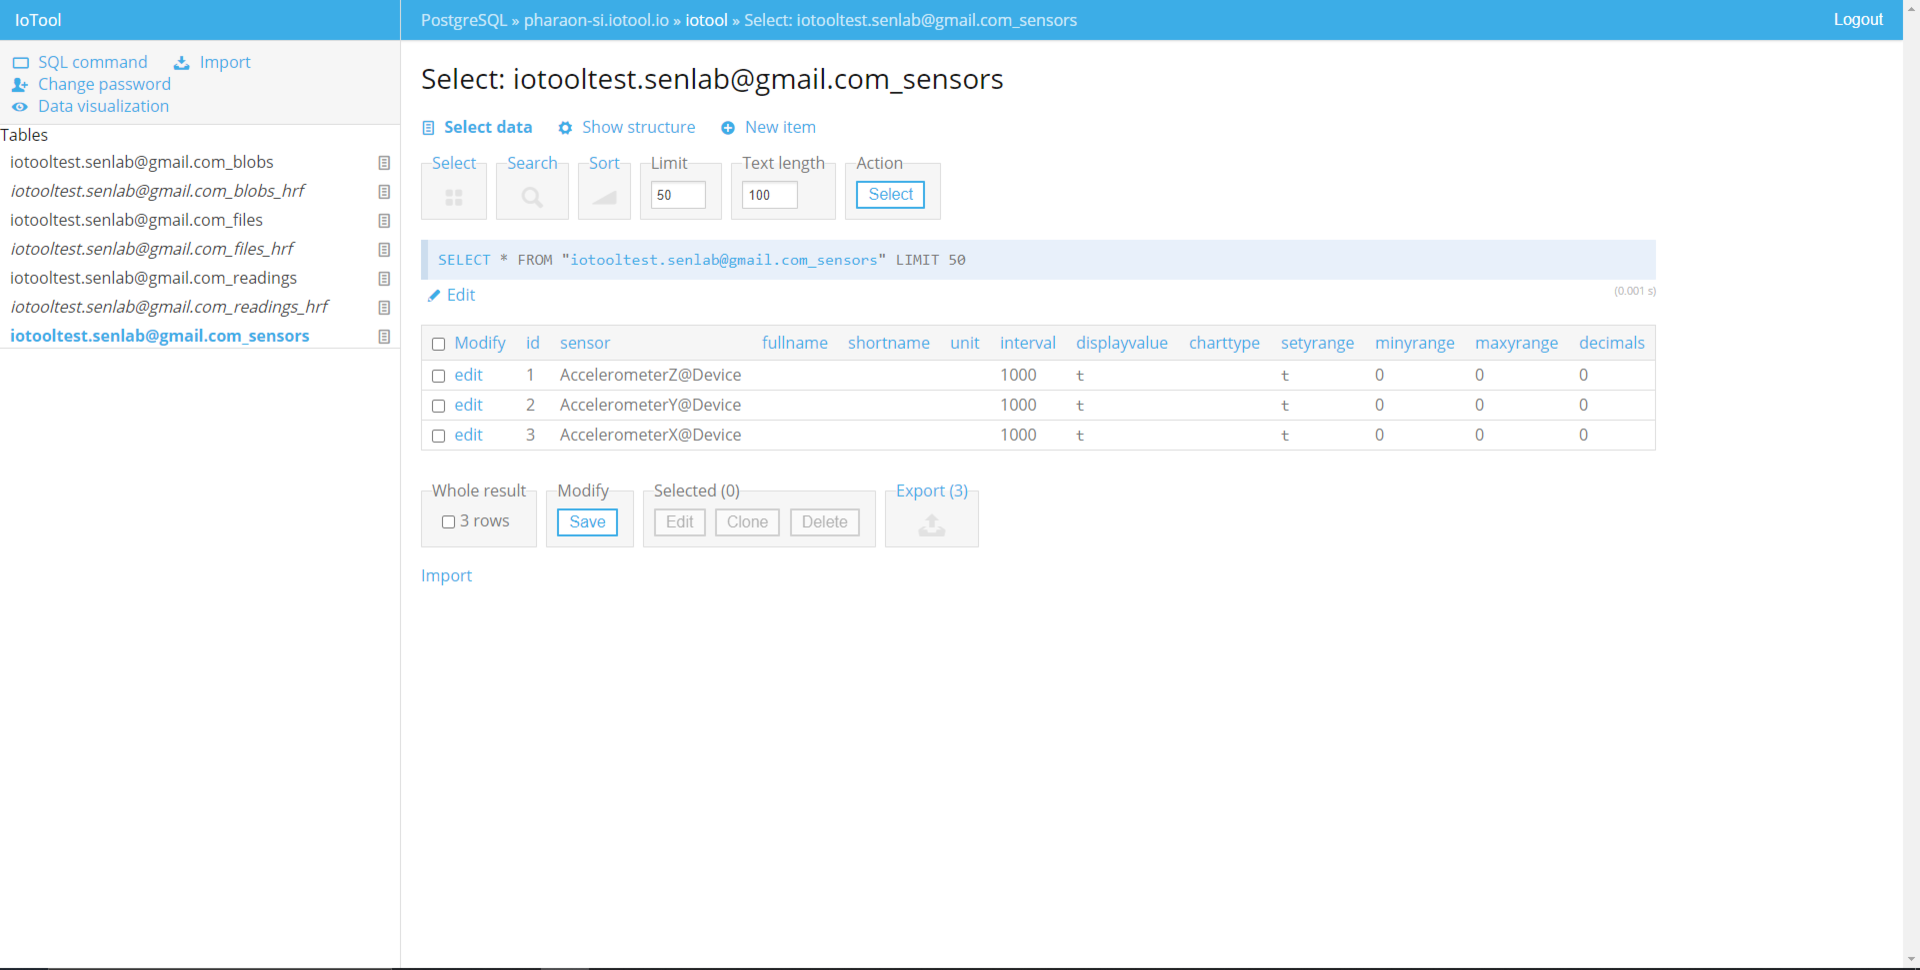
There is another similar table to this one, _readings; difference between these two tables is that in the first, data is presented in "human-readable" format and in the second in UNIX time format (in "computer-readable" format). To see available sensors, select _sensors and "Select data". Name of all the sensors are listed here; if the new sensor is used to send data to the cloud, its name should automatically appear here.
Grafana
Access Grafana from Adminer
To access Grafana from Adminer, select "Data visualization" on the side menu. Here are listed all the dahboards that contain graphs and panels with your data.
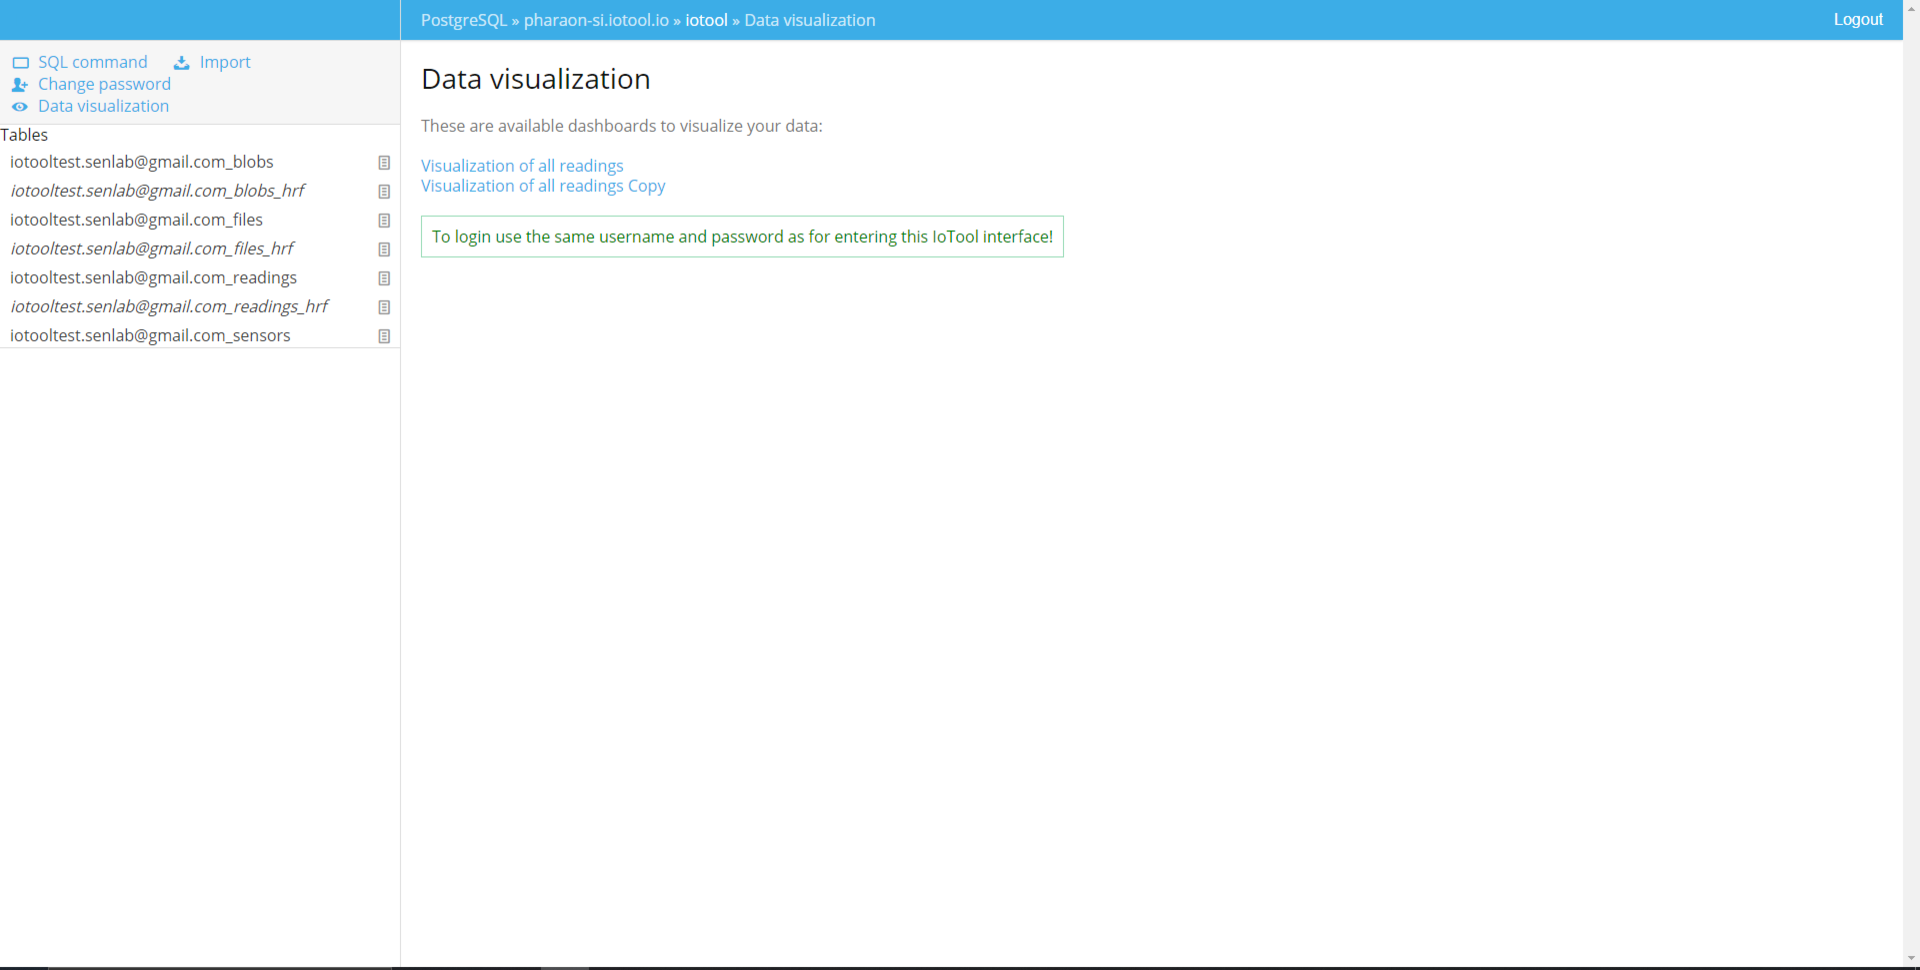
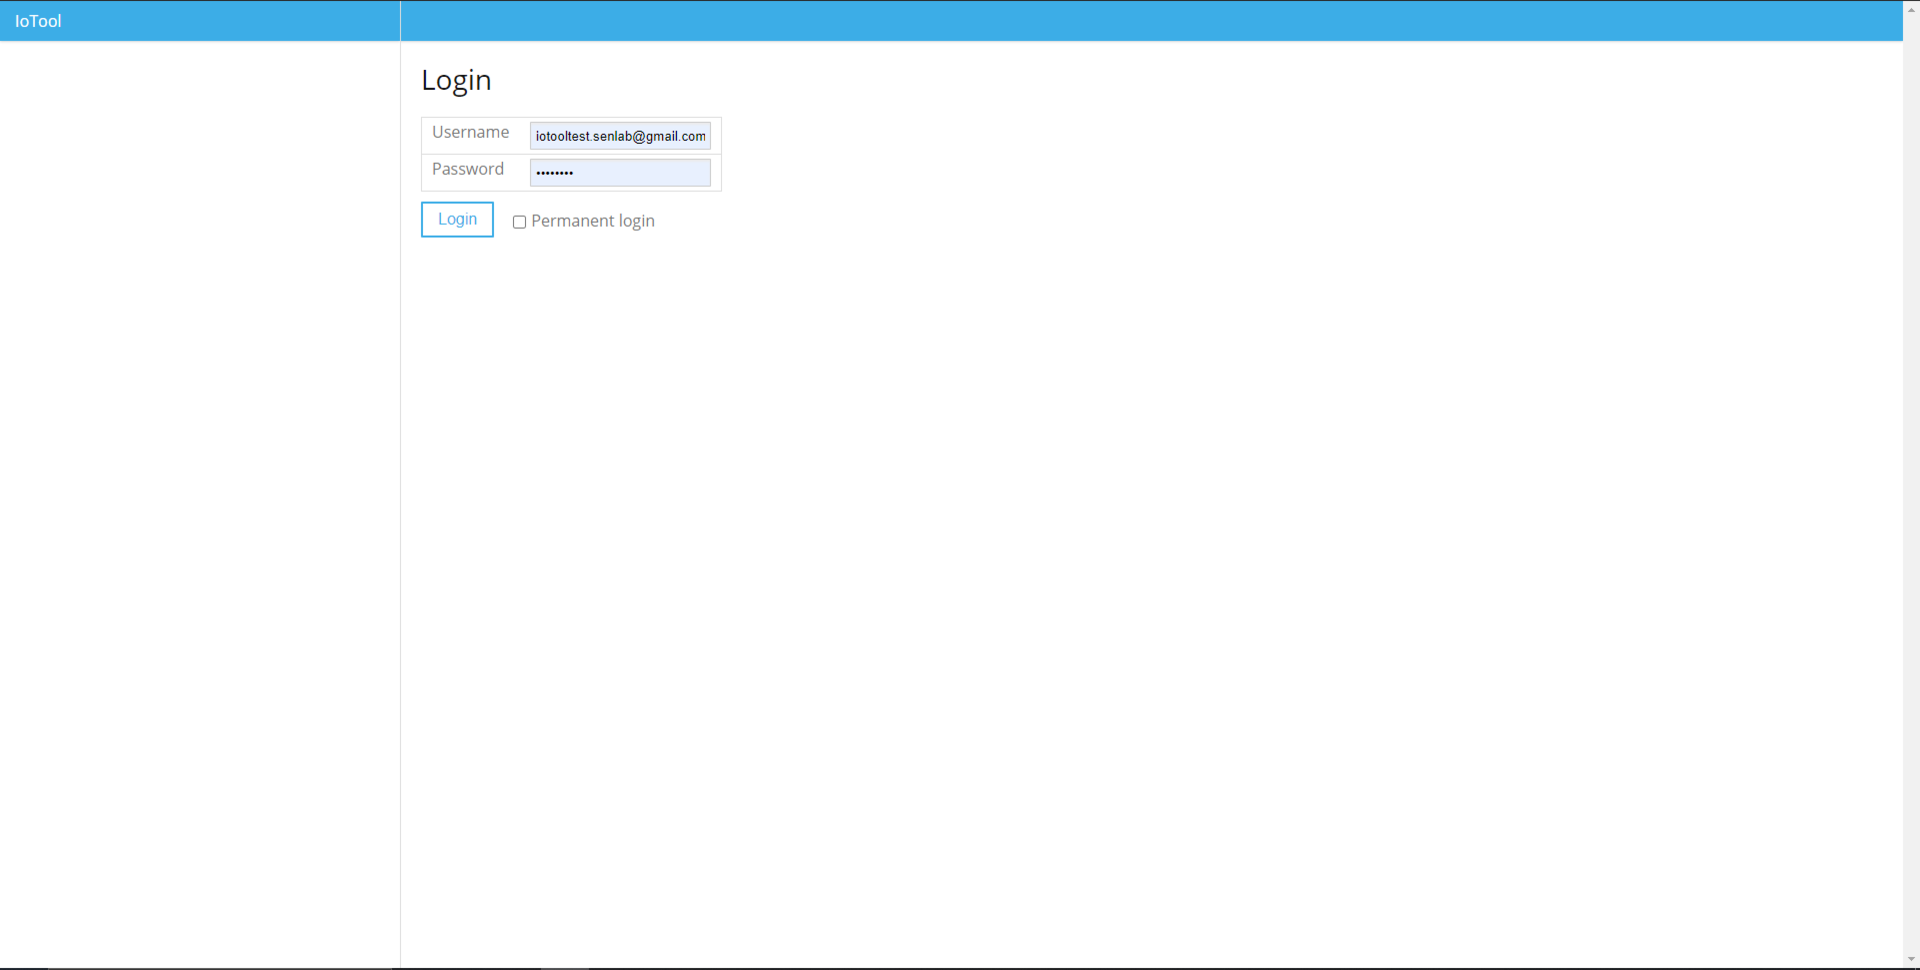
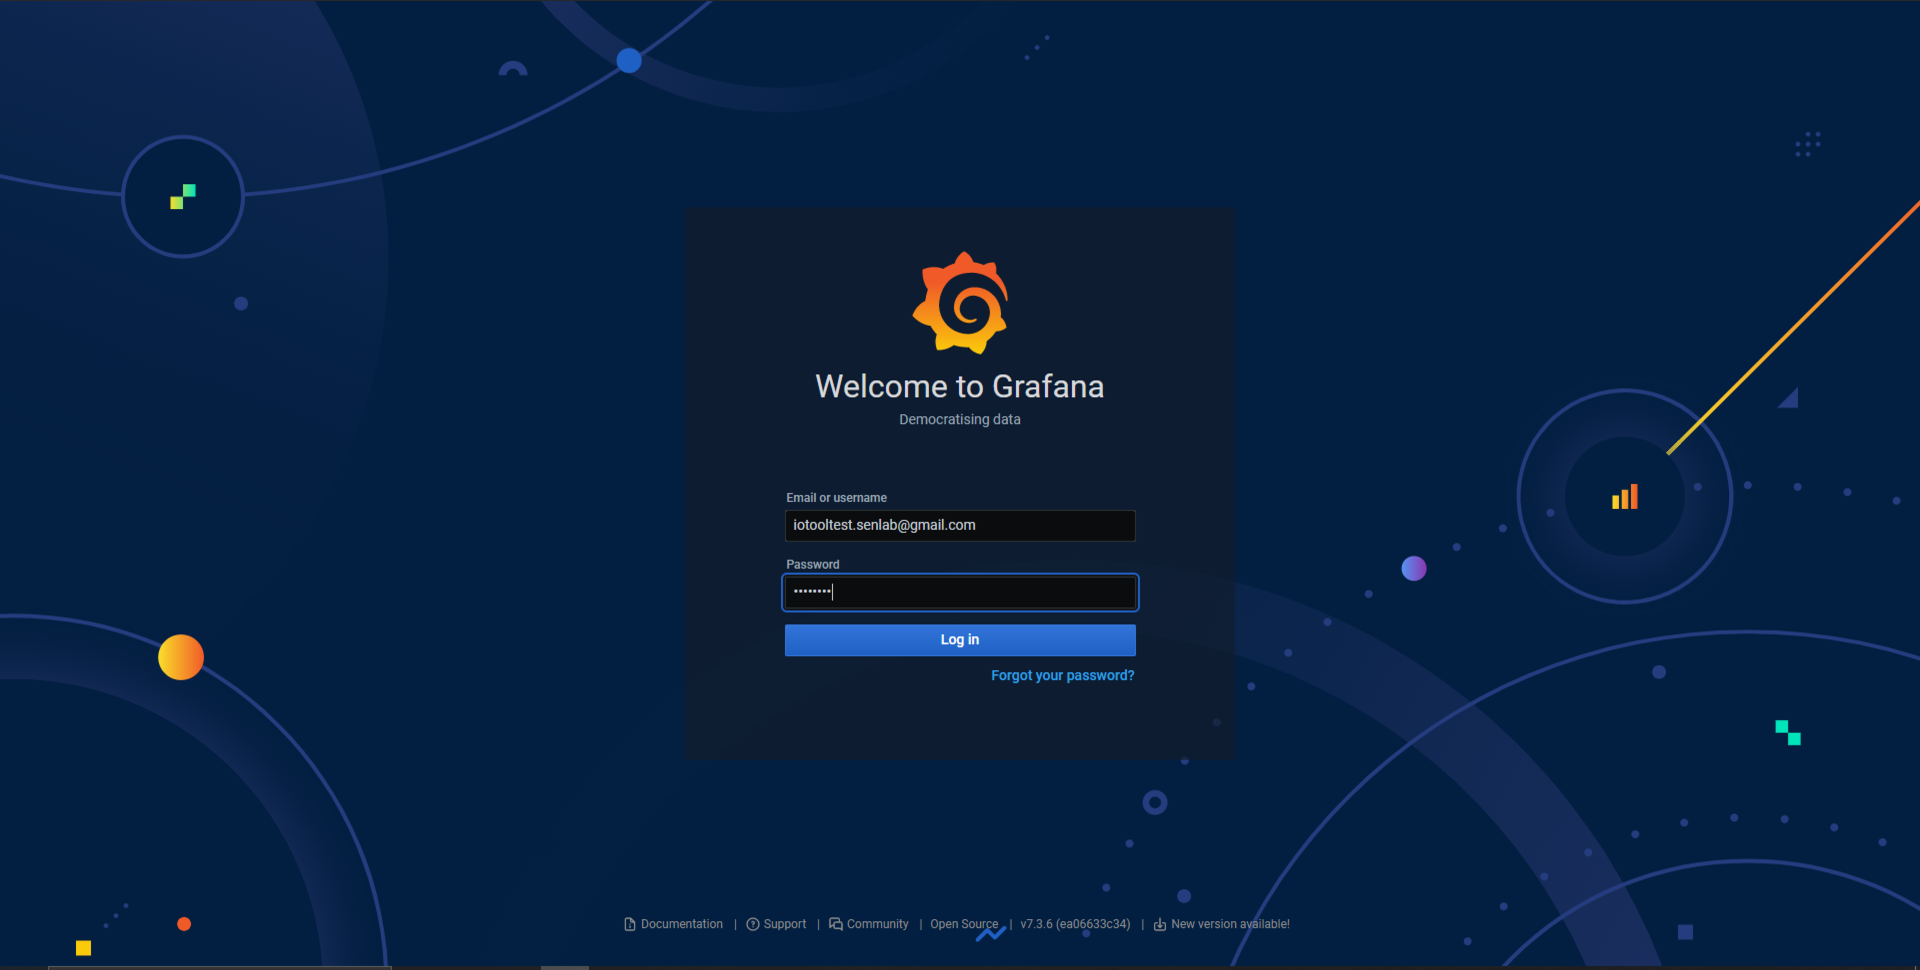
Click on the desired dashboard and the page will redirect you to Grafana log in screen. Sign in with same credentials you used to sign in to Adminer.
Dashboard
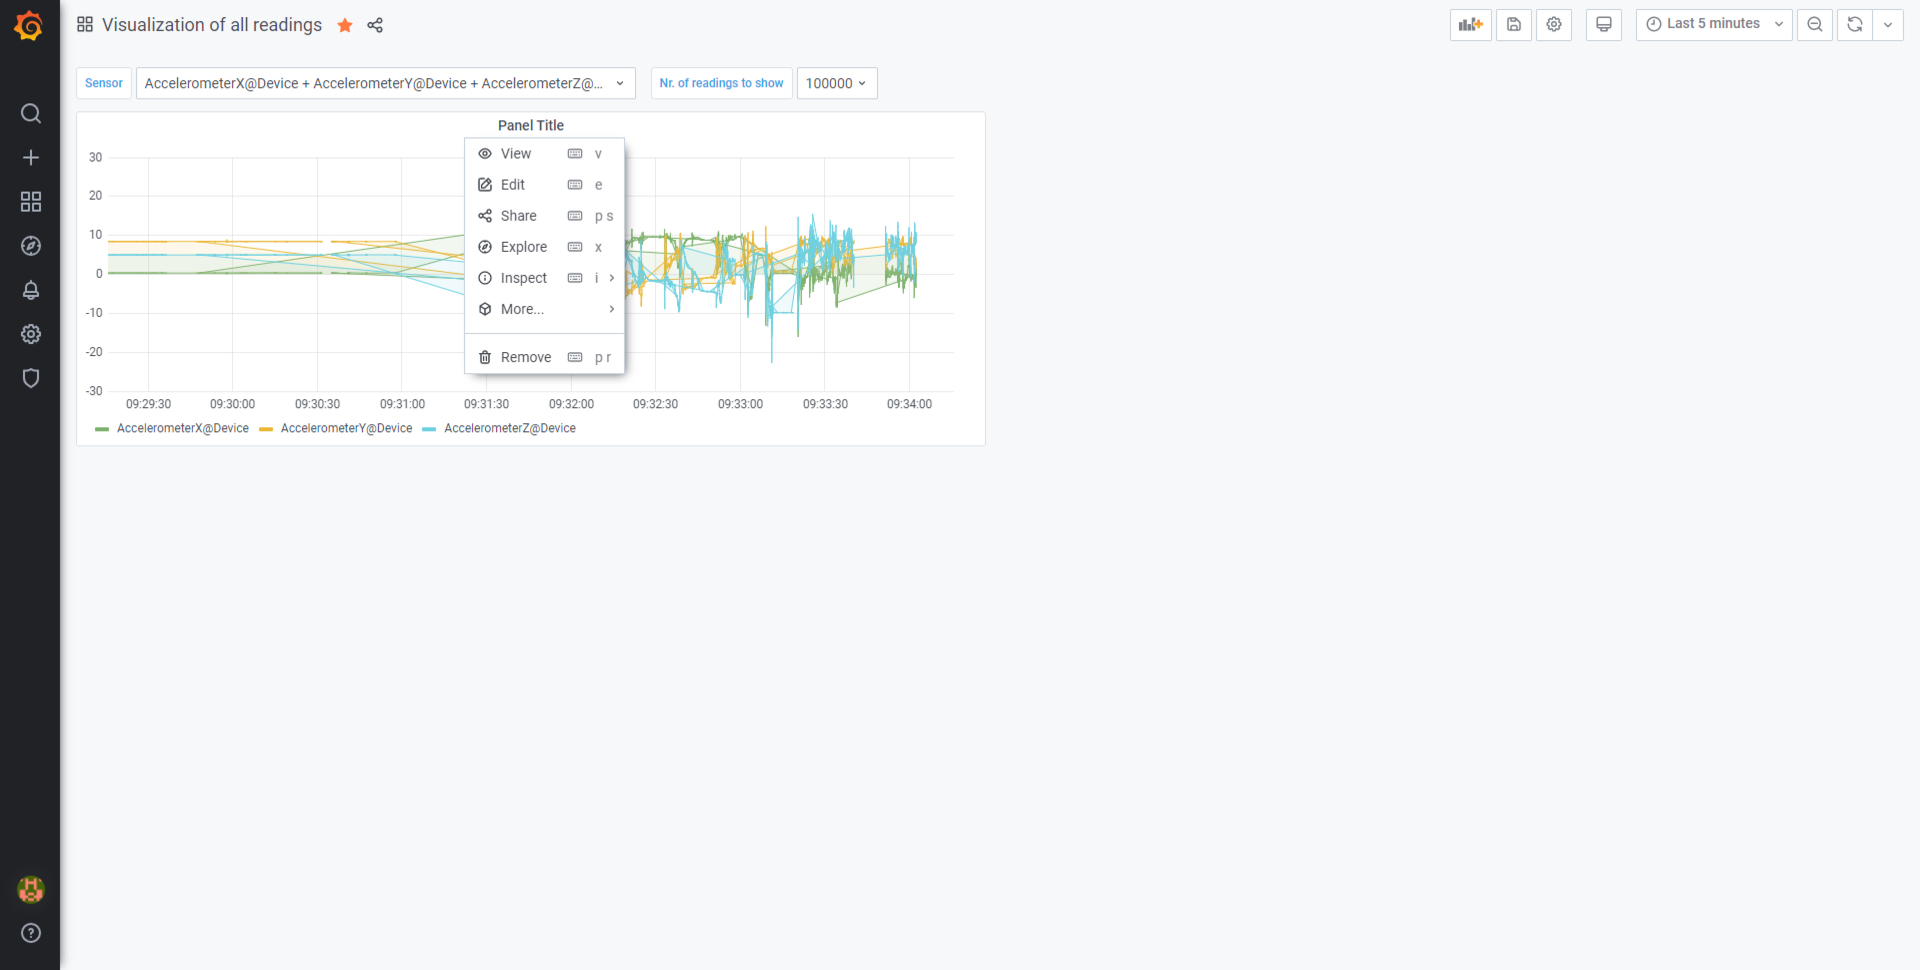
Dashboard with default settings will appear; it shows logged user’s data.
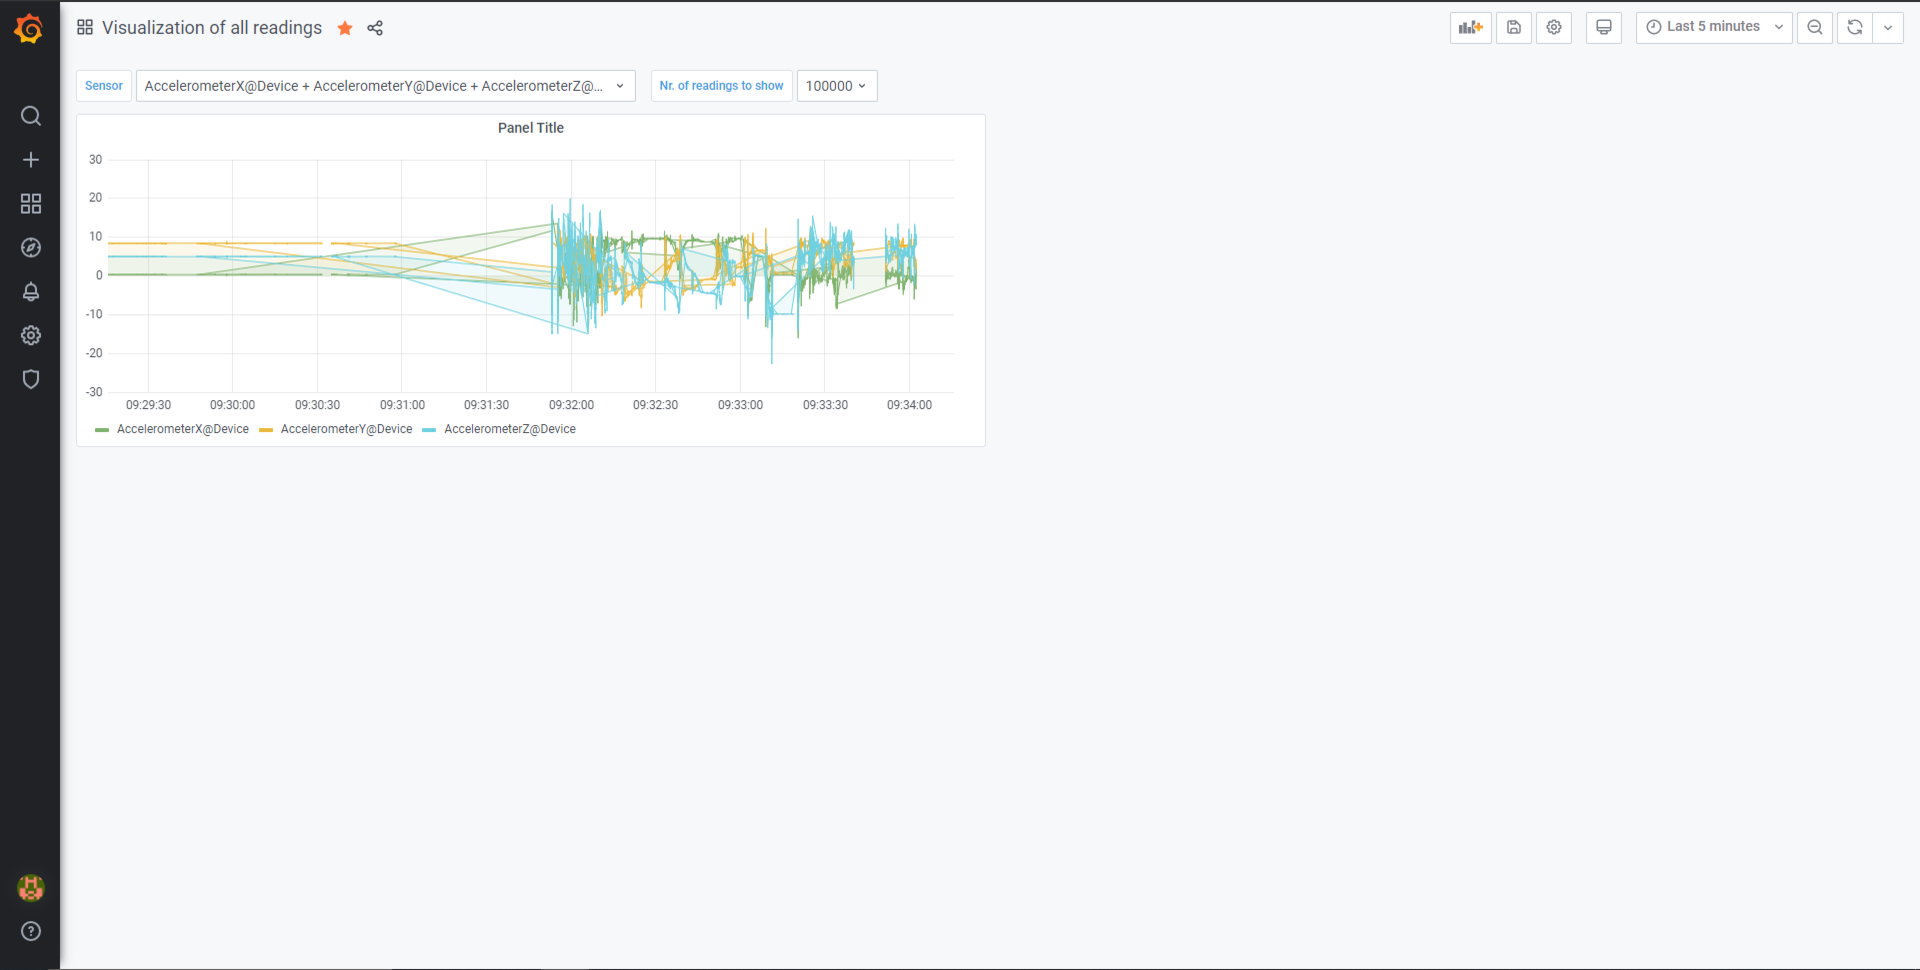
To show greater (or lesser) number of readings, select desired number from the dropdown menu "Nr. of readings to show" on the top of the dashboard.
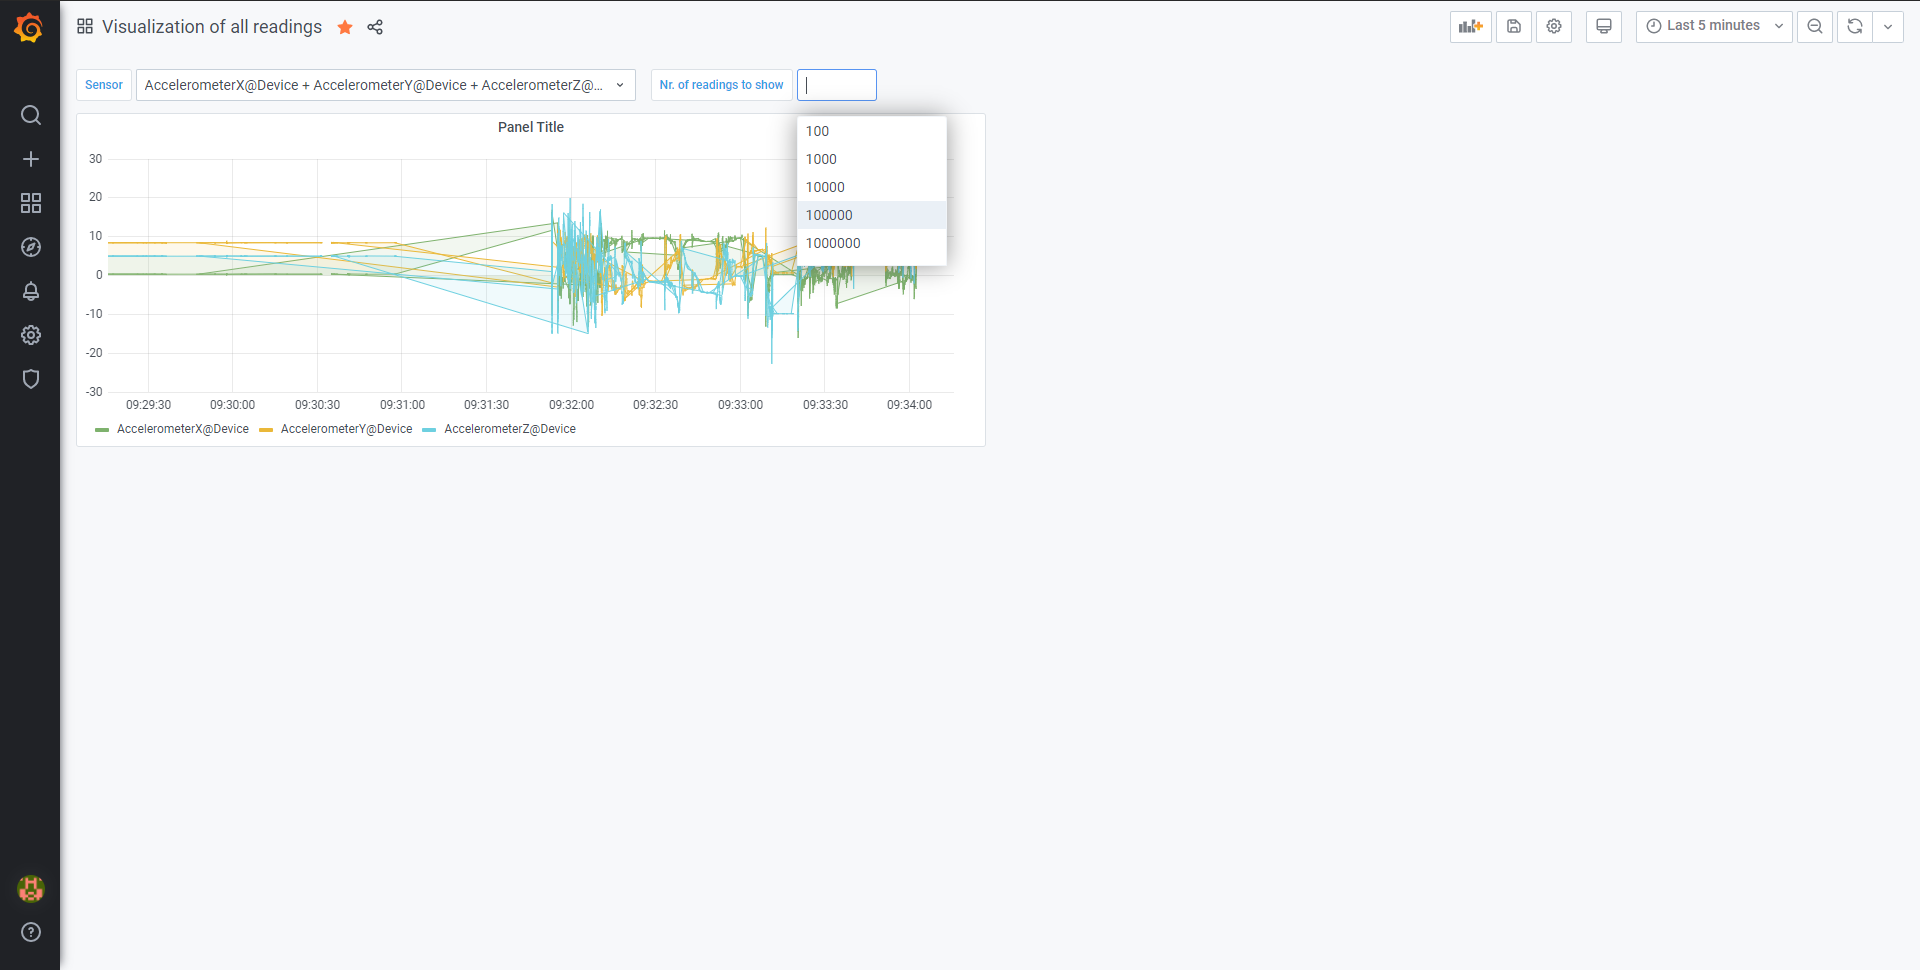
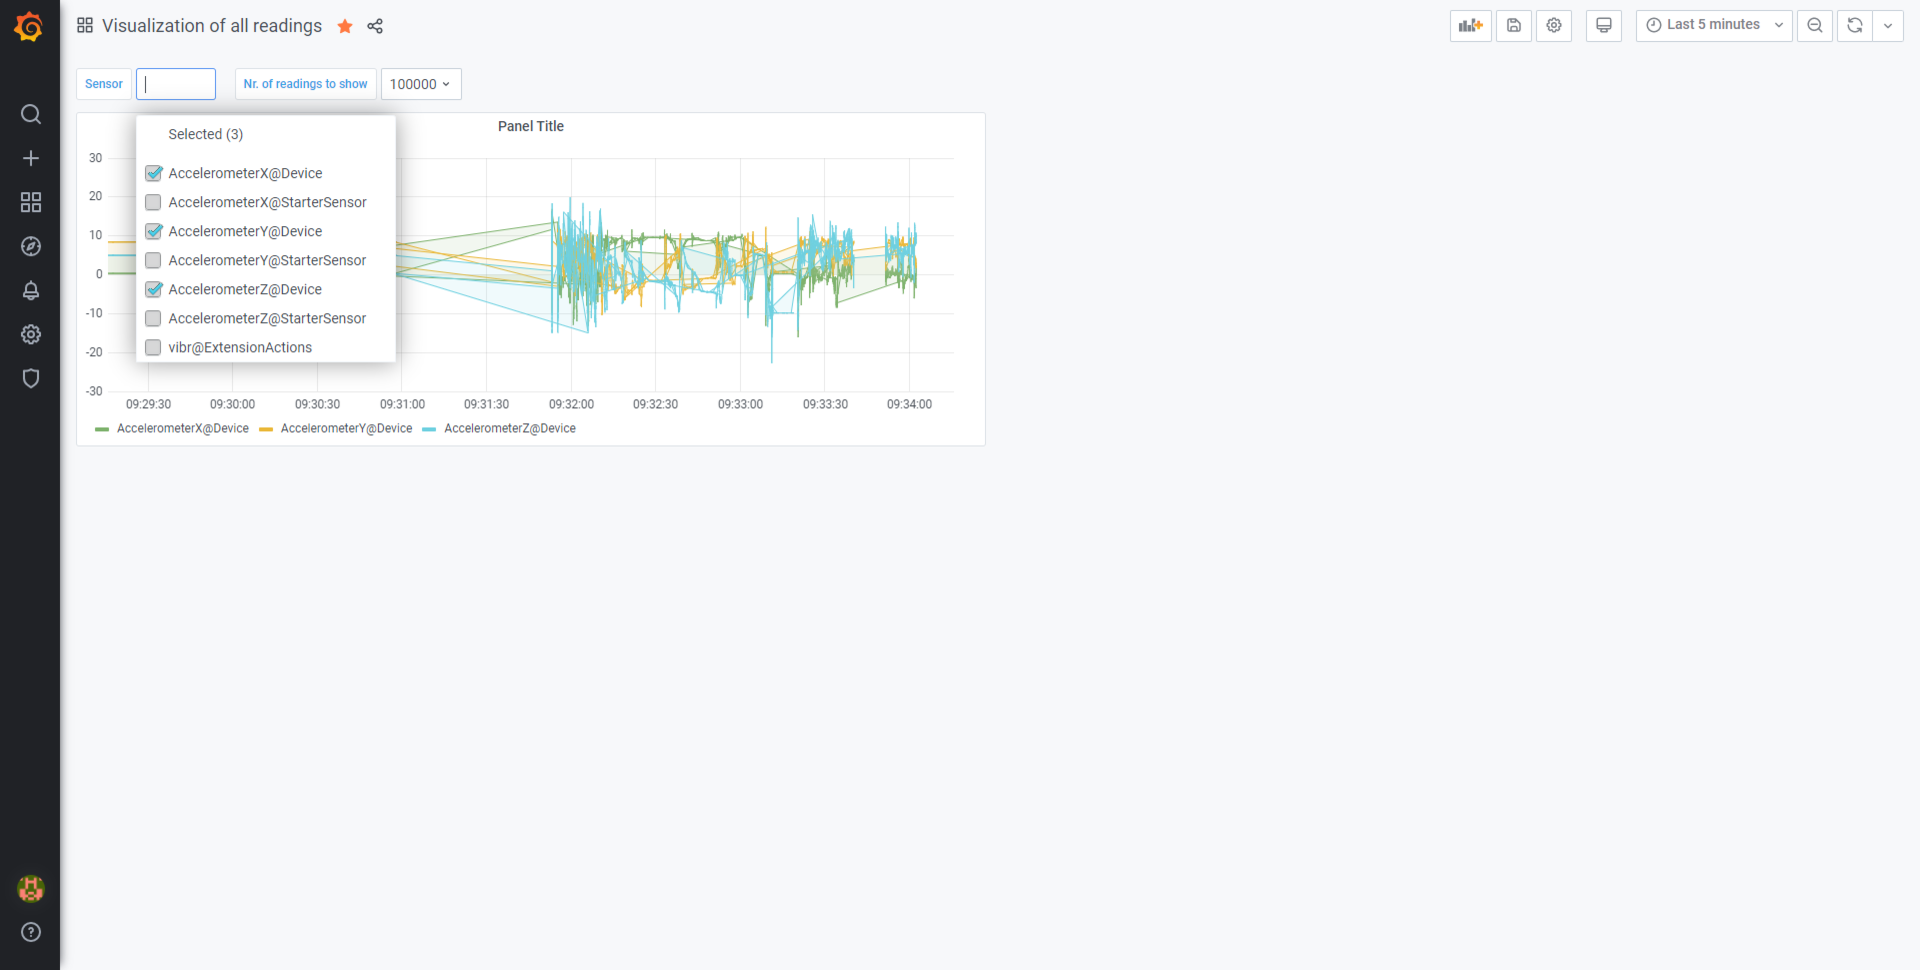
Next to this dropdown menu is another, named "Sensor", where you can choose which sensor’s data is shown. Multiple sensors can be selected and data from all will be shown.
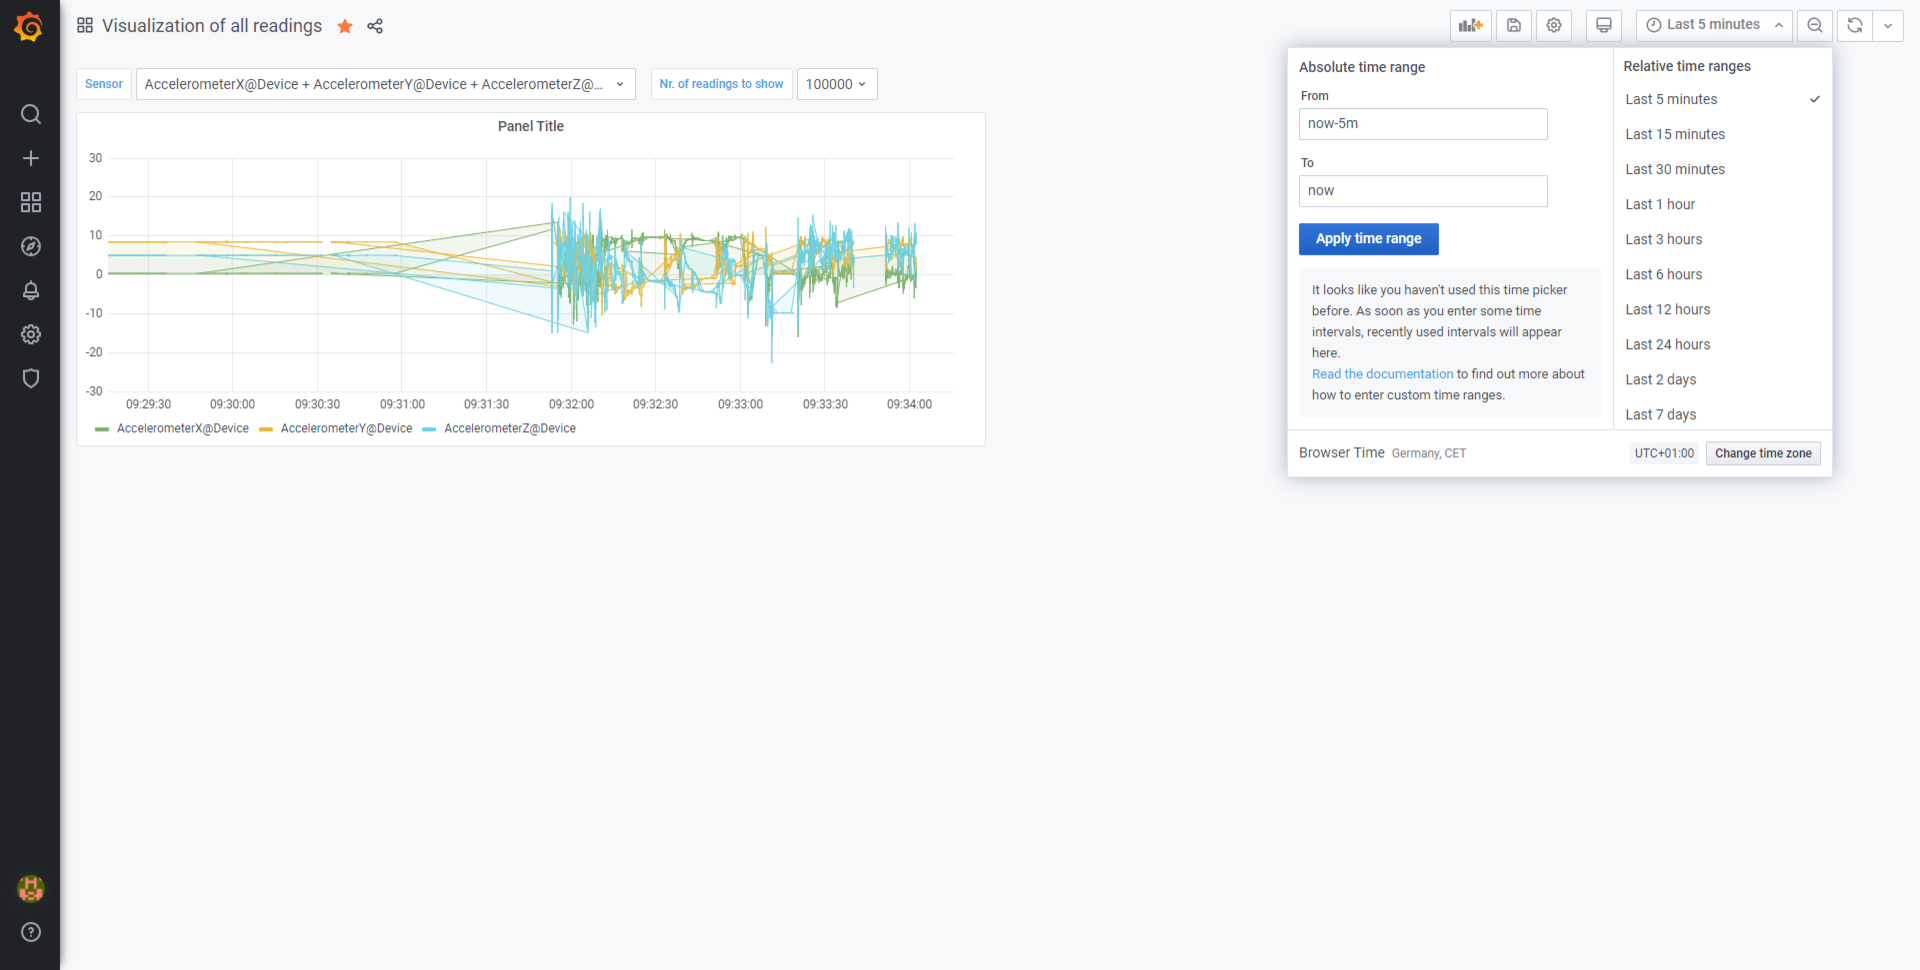
On the top right side there is a dropdown menu, where you can choose which time range your dashboard will show.
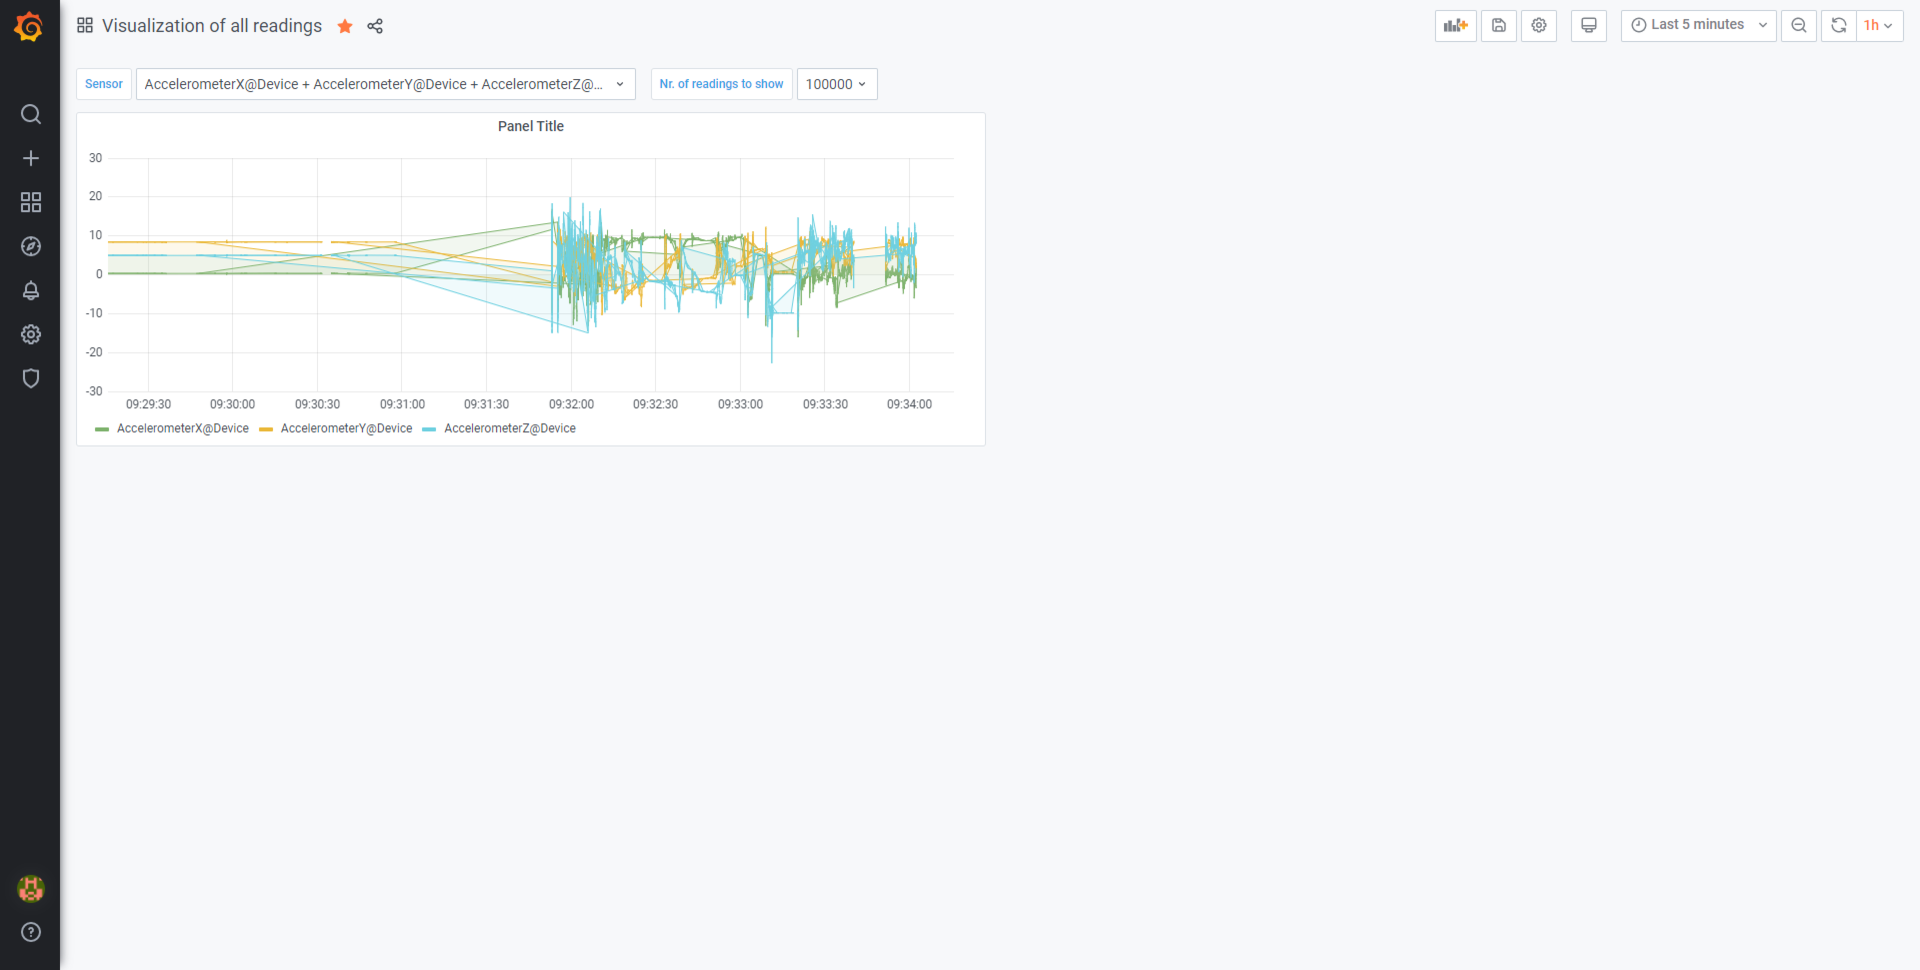
On the far right, there is a refresh button and a dropdown menu to choose the refresh rate - interval on which dashboard will be refreshed.
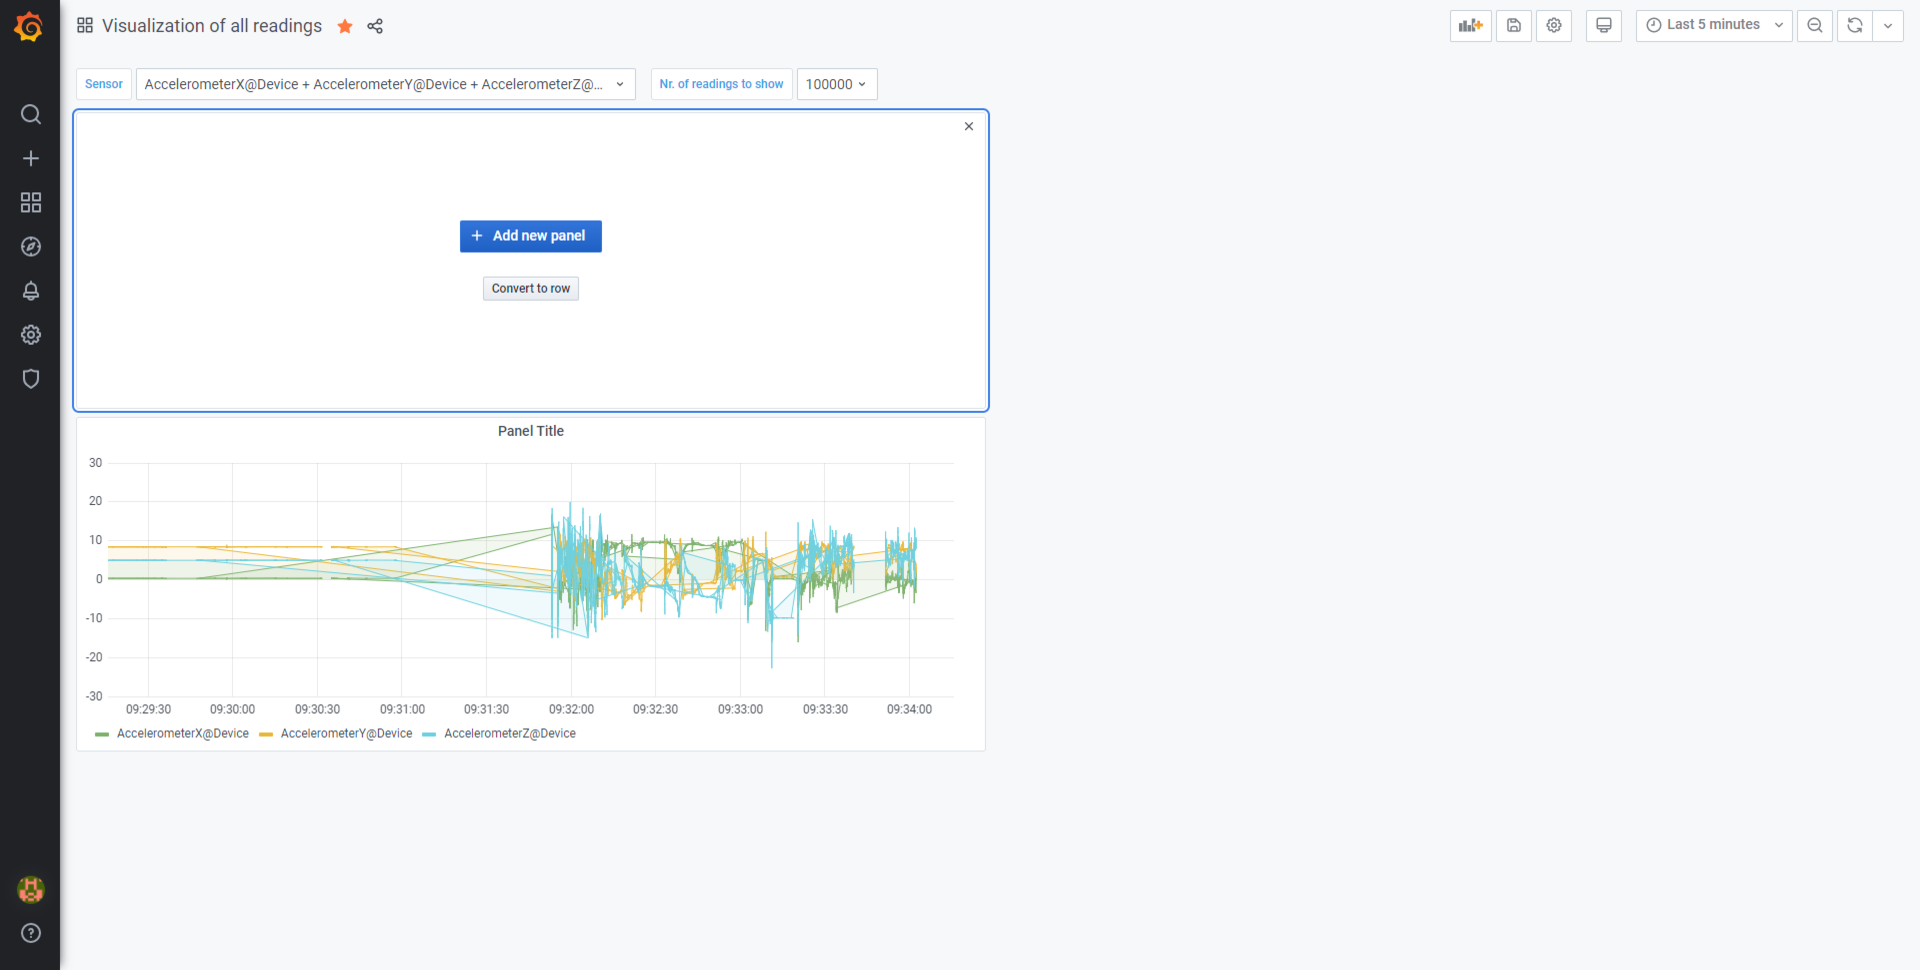
Adding new panel
Left of the time range is "Add panel" button, which will add new panel that can be customized.
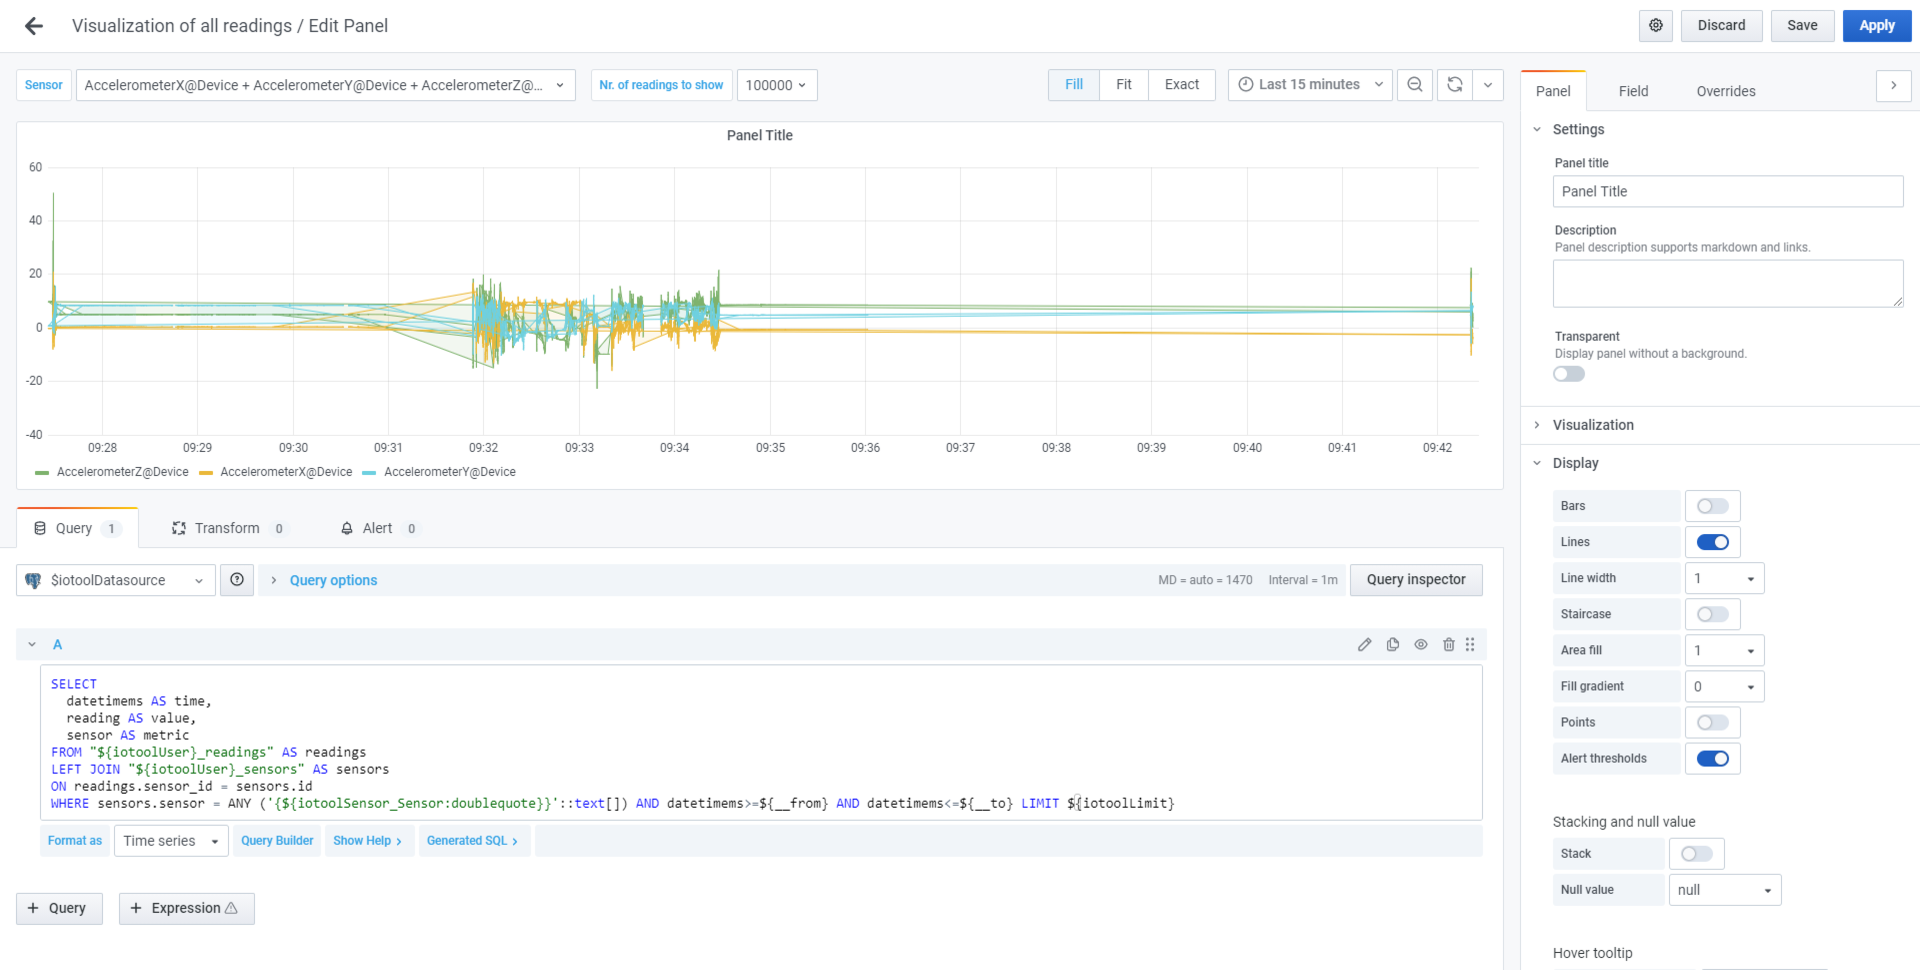
Click on panel’s name and select »Edit«, to edit panel’s settings. Data source should always be set to $iotoolDatasource. Below, "Edit SQL" button can be selected to edit a query. On the right side, the panel can be customized - you can select which type of graph will be shown and its style.
