Creating The Dashboard UI
Setting Up The Text Node
The Text node is used to visualize data on the UI. It will be displayed
in the format TEXT VALUE. This will be used to display the respective
sensor status. For the temperature sensor, create the node and set the
value of the Label field to Temp Active.
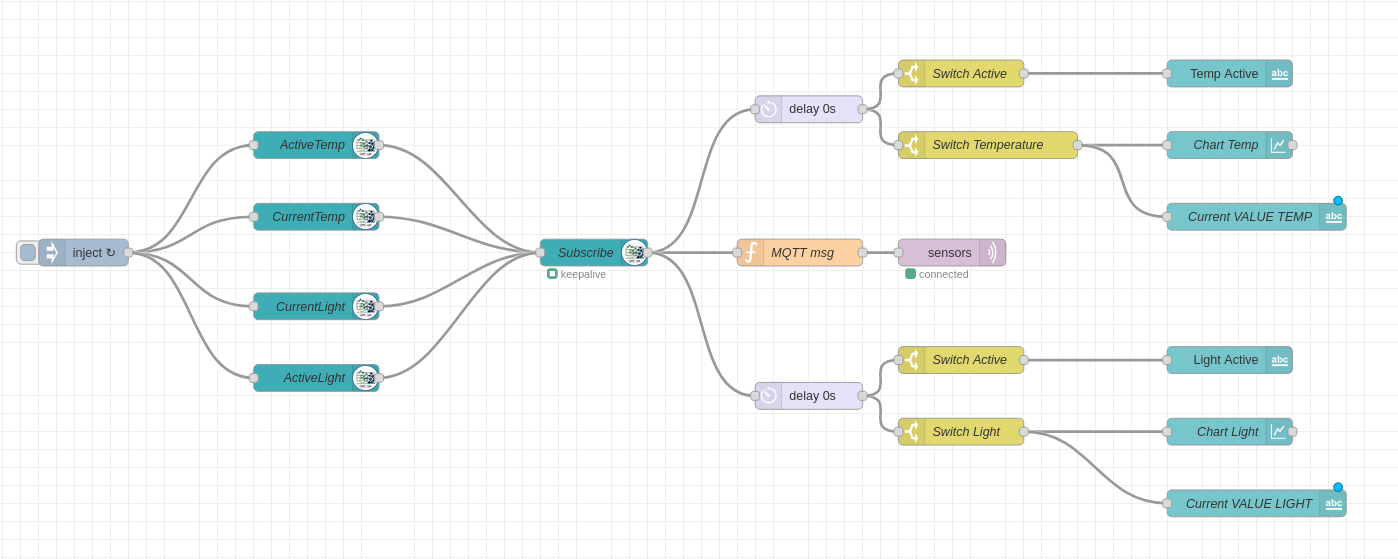
Since all values from all item nodes will flow down this connection, we
need to filter out the ActiveTemp item. To do this, we use the
msg.browseName and the Fork node#fig:switch-text[2.9].

We do the same for the ActiveLight value.
Setting Up The Chart Node
We use the same switch node for filtering out CurrentTemp and
CurrentLight values, but this time connect them to Chart nodes. Also
add a Text node for both values, to display the current values.
In the properties of the Chart node, we only set up the Label field.
We also add a Delay node, to delay the UI update times, if we wish to use it. The delay can just be set to zero or removed.
Finally, we connect all the switch nodes to the Client node and the switch nodes to the Dashboard nodes #fig:fin[2.10].
