cAdvisor
Overview
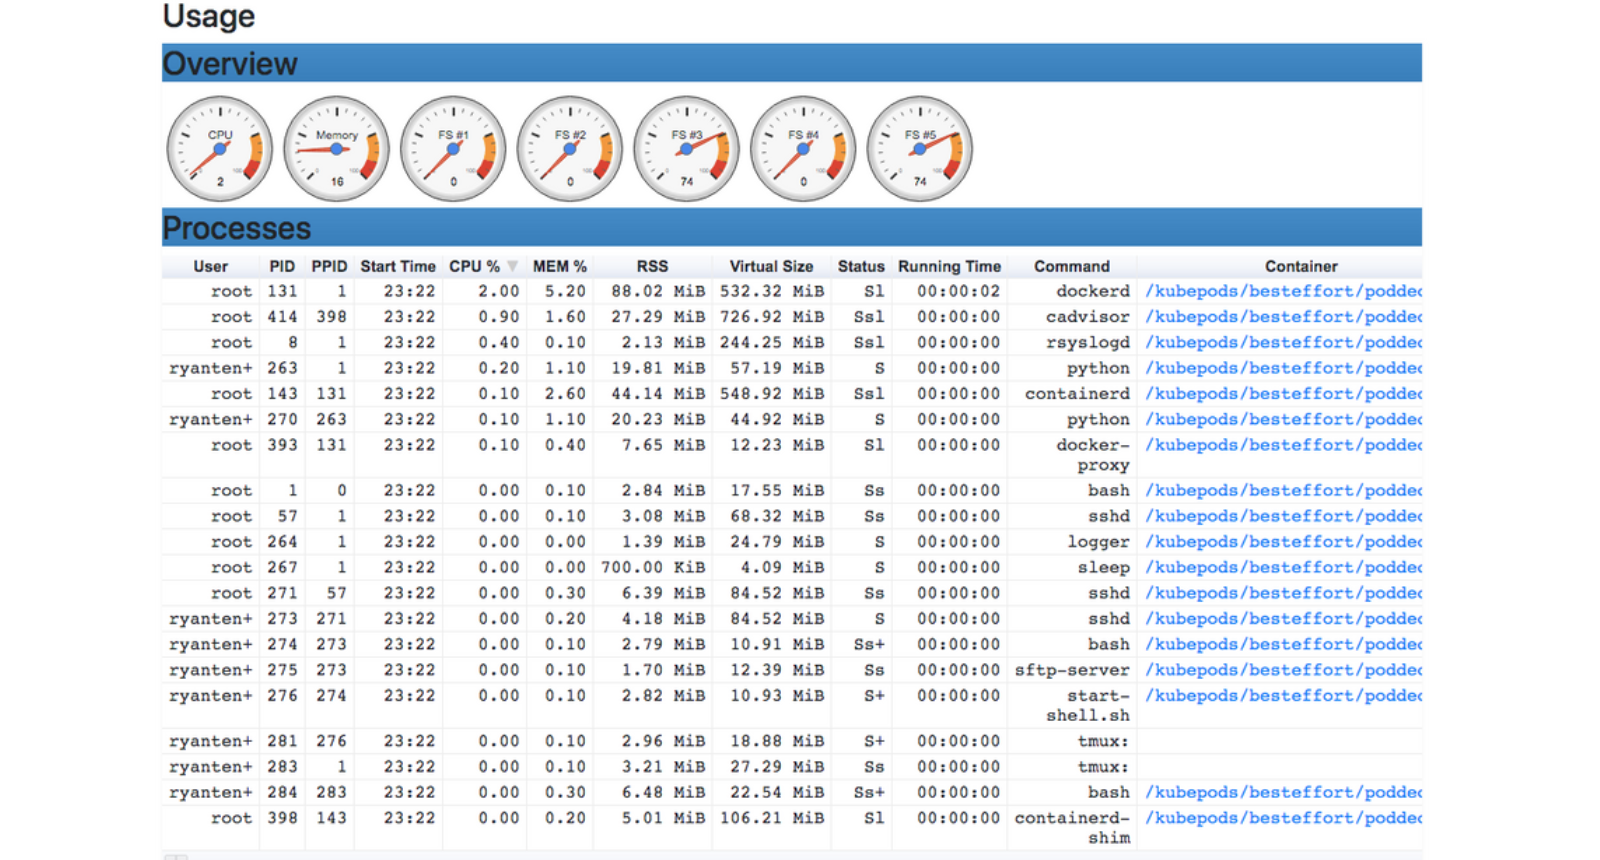
cAdvisor (Container Advisor) provides container users an understanding of the resource usage and performance characteristics of their running containers. It is a running daemon that collects, aggregates, processes, and exports information about running containers. Specifically, for each container it keeps resource isolation parameters, historical resource usage, histograms of complete historical resource usage and network statistics. This data is exported by container and machine-wide.

Key Features
-
Real-Time Monitoring:
cAdvisor provides real-time metrics on container resource usage, including CPU, memory, disk I/O, and network statistics. This enables users to monitor the performance of their containers continuously and respond to issues as they arise.
-
Detailed Metrics Collection:
Collects detailed metrics for each container, including resource utilization, application performance, and process-level statistics. This granularity helps in diagnosing performance issues and understanding container behavior.
-
Historical Data:
Stores historical metrics, allowing users to review performance trends over time. This feature is useful for identifying patterns and anomalies in resource usage.
-
Visualization:
Offers a web-based user interface to visualize container metrics through interactive graphs and dashboards. This interface helps users quickly interpret data and make informed decisions.
-
Integration with Monitoring Systems:
cAdvisor can integrate with external monitoring and visualization systems such as Prometheus and Grafana. This integration allows users to aggregate, visualize, and analyze container metrics alongside other system metrics.
-
Ease of Deployment:
cAdvisor is lightweight and easy to deploy, often running as a container itself. It requires minimal configuration and can be easily integrated into existing container orchestration environments like Kubernetes.
Use Cases
-
Container Performance Monitoring:
Ideal for monitoring the performance and resource usage of containers in a production environment, helping to ensure that containerized applications run efficiently and reliably.
-
Resource Optimization:
Helps in identifying resource bottlenecks and optimizing resource allocation by providing insights into CPU, memory, and I/O usage.
-
Capacity Planning:
Provides historical data and usage trends that aid in capacity planning and scaling decisions for containerized applications.
-
Troubleshooting and Debugging:
Useful for diagnosing performance issues and debugging container-related problems by offering detailed metrics and real-time data.
-
Integration with Observability Tools:
Works well with observability tools like Prometheus and Grafana, enabling comprehensive monitoring setups that include container metrics alongside other infrastructure data.