TensorBoard
Overview
TensorBoard is a tool for providing the measurements and visualizations needed during the machine learning workflow. It enables tracking experiment metrics like loss and accuracy, visualizing the model graph, projecting embeddings to a lower dimensional space, and much more
Key Features
-
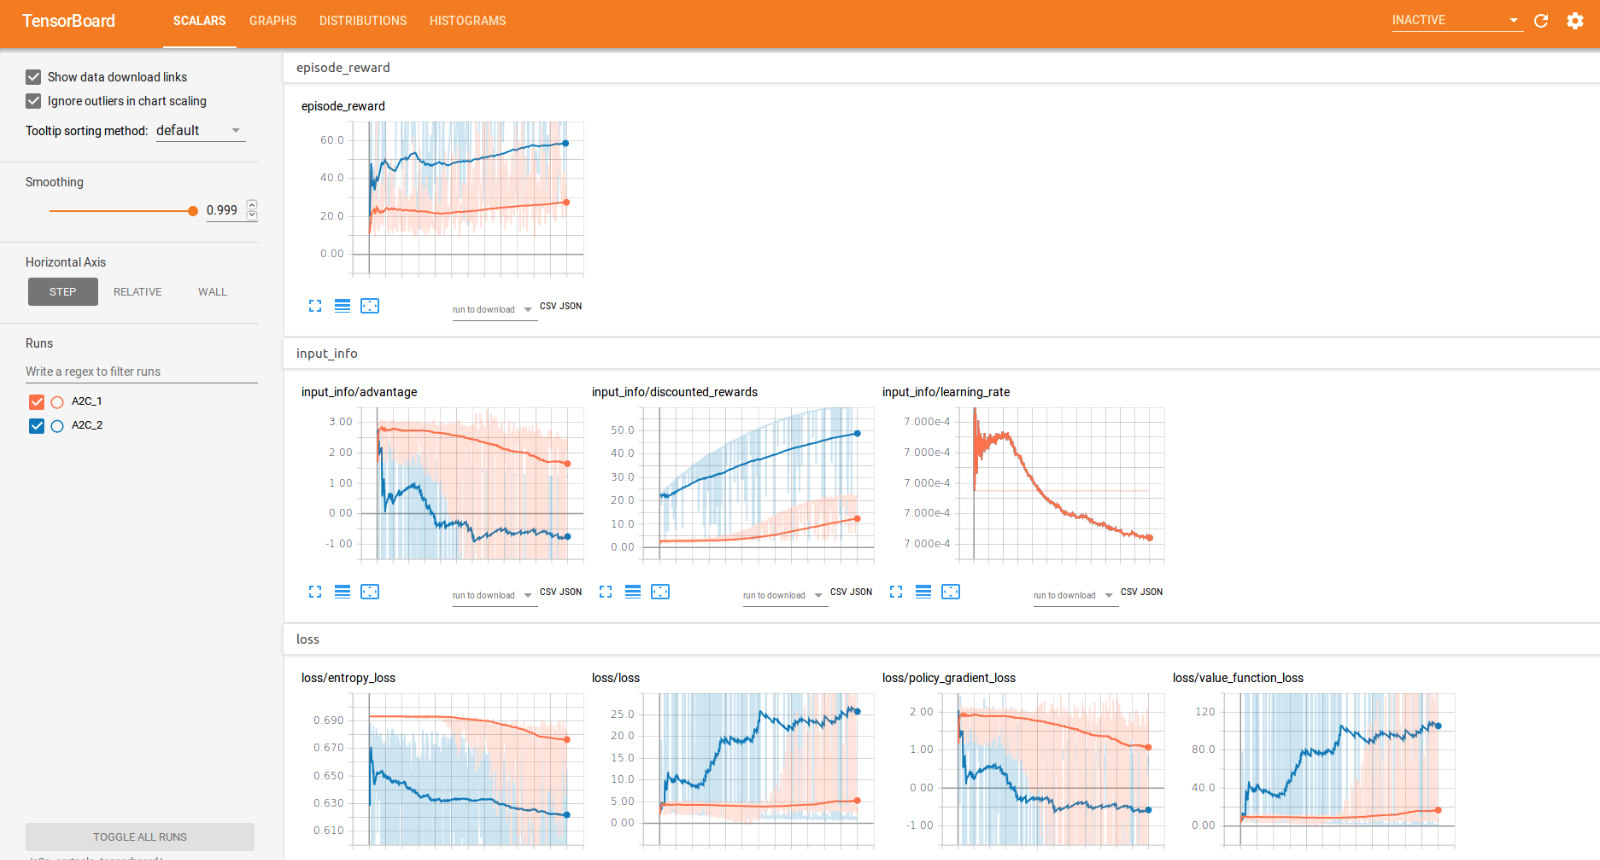
Visualization of Training Metrics:
TensorBoard provides detailed visualizations of training metrics such as loss, accuracy, and learning rates. These visualizations help users monitor the performance of their machine learning models and make informed adjustments during training.
-
Interactive Graph Visualization:
Offers interactive graph visualizations of computational graphs and model architectures. Users can explore the structure of their models, including layers and operations, to better understand and debug their neural networks.
-
Scalars and Histograms:
Supports the visualization of scalar values (e.g., training loss) and histograms (e.g., weight distributions) over time. These features help users track changes in model parameters and performance metrics throughout training.
-
Embeddings Projector:
Includes an embeddings projector for visualizing high-dimensional embeddings in lower-dimensional spaces. This tool is useful for exploring and understanding the relationships between learned features in models such as word embeddings.
-
Image and Audio Summaries:
Allows users to visualize images and audio samples directly within TensorBoard. This feature is beneficial for tasks involving computer vision and audio processing, providing insights into how models interpret and process different types of data.
-
Custom Dashboard Support:
Enables the creation of custom dashboards and visualizations. Users can extend TensorBoard’s capabilities by adding their own data visualizations and metrics to meet specific needs and preferences.
-
Integration with TensorFlow:
Seamlessly integrates with TensorFlow, making it easy to track and visualize TensorFlow training processes. TensorBoard can be used with TensorFlow’s tf.summary API to log and display various metrics and data.
Use Cases
-
Model Training Monitoring:
Ideal for monitoring and analyzing the training process of machine learning models. TensorBoard helps track metrics, visualize performance trends, and detect issues during model training.
-
Model Debugging:
Useful for debugging and understanding complex models. Interactive graph visualizations allow users to inspect model architectures and identify potential issues in the computational graph.
-
Performance Tracking:
Facilitates the tracking of model performance over time. Users can visualize and compare different runs, hyperparameters, and training configurations to optimize model performance.
-
Data Visualization:
Assists in visualizing and interpreting high-dimensional data. The embeddings projector and image/audio summaries help users understand the representation and processing of data within their models.
-
Custom Metrics and Reporting:
Supports the creation of custom visualizations and dashboards. Users can add custom metrics and reports to TensorBoard to meet specific analysis and reporting requirements.